Based on a True Story Case 4 - A SQL-Based AvT Allocation Model: Because Not All Days Are Created Equal
A practical method for allocating monthly targets across nonlinear business days

Part of the “Based on a True Story” Series - Case 4
The nonlinear progression of business metrics over time makes it difficult to know where we truly stand against our targets and forecasts at any given point in the month. Many targets are set monthly, yet managers naturally want visibility at shorter intervals - and sometimes for reasons that go well beyond simple curiosity.
What We’ll Cover
- Why a simple linear MTD model can distort Actual vs. Target (AvT) projections
- What drives intra-month nonlinearity in business metrics
- How to generate a business-specific calendar table using a precise LLM prompt
- How to build the remaining SQL-based allocation model and use it for AvT analysis
Disclaimer
The case you’re about to read is inspired by real events at an online-platform company. Certain field names, market verticals and operational details have been altered to protect sensitive information. Any resemblance to a real business case is not coincidental - because it is one.
Our Business Case Study: Fashion4Seasons Predicts the Present

To illustrate the problem, we’ll return once again to our beloved online fashion retailer - Fashion4Seasons, home of questionable fashion decisions, ambitious marketing campaigns, and increasingly sophisticated SQL.
This time, our protagonist is Klaus Kursorsson, Senior Manager, Commercial Performance & Downside Discovery.
In October 2025, Fashion4Seasons launched the Nordic Office Revival - a campaign intended to revive its underperforming premium workwear category across Sweden, Denmark, Finland, and Norway.
The campaign combined targeted discounts, prominent homepage placement, paid social, and a tasteful advertising concept built around the slogan:
“Dress Like You Still Have a Desk.”
FP&A had set an October sales target of $3 million.
Importantly, that $3M target was already a monthly target. FP&A had anchored it in previous October performance and the expected seasonality of October, then adjusted it for current business assumptions. In other words, October-level seasonality had already been accounted for. (Apparently, someone in FP&A had read my previous posts on seasonality corrections and time series counterfactuals)
In other words, the problem here was not to predict October again, nor to estimate the incremental uplift generated by Dress Like You Still Have a Desk. We will simply take the $3M FP&A target as given.
The problem was how to determine where Fashion4Seasons should stand against that target before the month was over.
Marketing had deliberately reserved part of the campaign budget. If sales appeared to be progressing well against the October target, an additional tranche would be released and invested while the campaign was still running.
If performance appeared weak, the money would instead be moved into the increasingly sacred Black Friday budget.
On the morning of October 13, management asked Klaus the obvious question:
“Are we on track for the $3M target?”
Fashion4Seasons had generated approximately $980K during the first 13 days of October.
Klaus did what analysts have been doing since somebody first discovered division:
$980K ÷ 13 × 31 ≈ $2.34M
Target: $3.0M.
Forecast: $2.34M.
Approximately 78% of target.
Klaus frowned.
This was, professionally, one of his stronger skills.
Performance was classified as under target. The second marketing tranche was cancelled, paid-social budgets were reduced, and the remaining funds were reassigned to Black Friday.
There was only one problem.
October was not 31 identical days.
The first 13 days happened to contain an unusually weak mix of them.
October 3 was National Lagom Day, created by Swedish fashion retailer Ellos to celebrate the Swedish principle of lagom - roughly, neither too much nor too little.
This did not prove particularly helpful to a campaign whose commercial objective was, broadly speaking, more.
The first 13 days also contained four weekend days.
That mattered because the Nordic Office Revival sold officewear, and Fashion4Seasons’ historical data showed a pronounced weekday effect. Customers were significantly more interested in improving their office wardrobe while actually sitting in an office.
The remaining part of October had a more favorable weekday mix.
There was also a recurring late-month pay-cycle effect in Fashion4Seasons’ Nordic business, with sales typically accelerating during the final week.
And October 31 itself was a Friday - historically one of the stronger combinations of day-of-month and day-of-week for the category.
In other words, 42% of October’s calendar days had elapsed, but that did not mean that 42% of the October target should already have been achieved.
Applying Fashion4Seasons’ historical day-of-week and week-of-month patterns to the actual October 2025 calendar showed that by October 13, only around 31-32% of the month’s expected activity should have occurred.
So the relevant comparison was not:
$980K ÷ 42%
but, expressed as a full-month pace equivalent:
$980K ÷ 31.5% ≈ $3.11M
For the AvT model, however, the cleaner comparison is directly against the allocated FP&A target:
Expected target through October 13:
$3.0M × 31.5% = $945K
Actual sales:
$980K
Actual vs. Target:
$980K ÷ $945K ≈ 104%
Klaus’s linear extrapolation had implied approximately 78% of target.
The time-adjusted AvT calculation showed that Fashion4Seasons was actually running at approximately 104% of its expected target pace.
The campaign Fashion4Seasons had just decided to cut was, in fact, broadly on track.
And now the problem became even messier.
Because management had acted on Klaus’s calculation, Fashion4Seasons reduced marketing spend before the part of the month in which the business was historically expected to generate more of its sales.
The forecast had not merely described the future incorrectly.
It had helped change it.
By month-end, the initiative really did finish below target - allowing Klaus’s original forecast to look considerably more intelligent than it deserved.
His arithmetic had been perfectly correct.
His assumption that 42% of the days meant 42% of the opportunity had not.
This is the danger of naïve Month-to-Date extrapolation.
The standard approach:
MTD ÷ elapsed days × days in month
assumes that business activity is distributed uniformly across the calendar.
Real businesses rarely behave that way.
They have weekday effects, weekends, holidays, salary cycles, billing cycles, campaign schedules, month-end effects, and recurring behavioral patterns that make some parts of the month structurally more important than others.
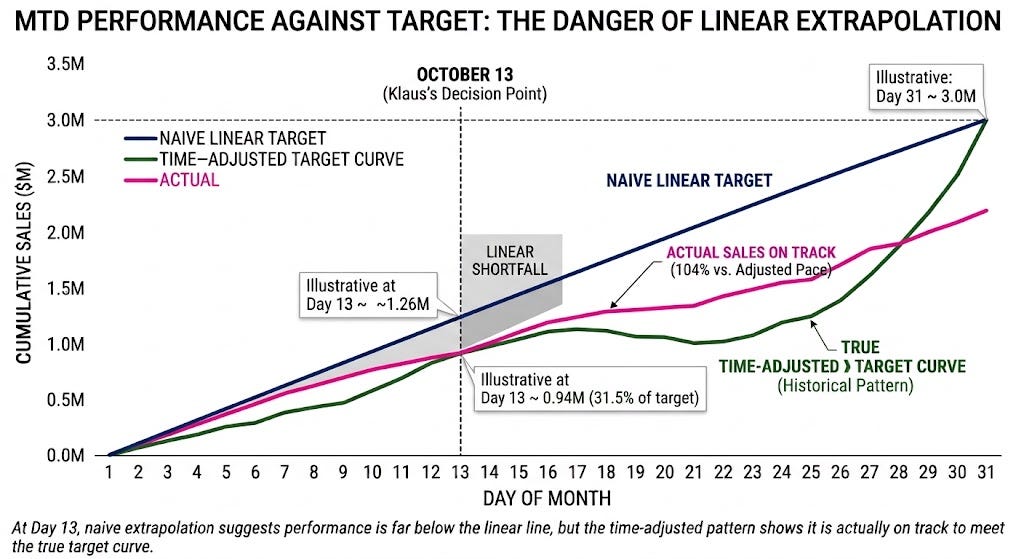
October 13 is therefore not necessarily 42% of October.
The more useful question is:
Given the historical intra-month behavior of the business, what percentage of this month’s target should have been achieved by October 13?
And once we know that, we can build a much better Month-to-Date AvT measure - using nothing more exotic than SQL.
We know already that not all months are created equal - as discussed in my previous Fashion4Seasons case, Because Your MoM and YoY Lie.
But we must also acknowledge that not all weeks within a month, or days within a week, are created equal either.
Business activity often varies systematically by week of month (WoM) and day of week (DoW).
Moreover, not all Mondays are equal. A Monday that falls on the 1st of the month may behave very differently from a Monday that falls on the 31st. Likewise, the 1st of the month may look very different when it falls on a Sunday than when it falls on a Monday.
In other words, intra-month behavior is not driven by a single calendar effect. It is shaped by the combination of where we are in the month and where we are in the week.
Adding to that, holidays can make intra-month allocation look almost impossible to model. Some occur on fixed Gregorian dates, while others - such as Chinese New Year or Ramadan - shift across the Gregorian calendar from year to year, distorting otherwise recurring patterns.
Fortunately, the solution is much simpler than it might first appear.
Step 1: Build a Calendar Table
Start by building a calendar table that maps each date to its relevant calendar attributes - for example: Date, Year, Month, Day of Week, Day of Week Name, and Week of Month.
Then add flags for recurring calendar effects that may influence business activity, such as:
Is_WeekendIs_Month_StartIs_Month_End- useful for businesses with payment or activity concentrations around the beginning or end of the monthIs_Quarter_End- relevant for businesses affected by quarterly payment cyclesIs_Year_EndIs_Christmas_DayIs_New_Years_EveIs_New_Years_DayIs_Veterans_DayIs_CNY_Day (Chinese New Year Day)
A useful extension is to add holiday windows, rather than flagging only the holiday itself. For example:
Is_CNY_Dm1- the day before Chinese New YearIs_CNY_Dp1- the day after Chinese New Year
The exact set of flags will differ by business. The important point is to capture the calendar-driven effects that are actually relevant to your own activity patterns.
Create a sufficiently broad timeframe that includes both historical years - used to derive allocation weights from past business activity - and future years, so the same calendar structure can support upcoming allocations.
How to build it? One simple option is to ask your favorite LLM to generate a reproducible script that builds the table for you.
Prompt
1
2
3
4
5
6
7
8
9
10
11
12
13
14
15
16
17
18
19
20
21
22
23
24
25
26
27
28
29
30
31
32
33
34
35
36
37
38
39
40
41
42
43
44
45
46
47
48
49
50
51
52
53
54
55
56
57
58
59
60
61
62
63
64
65
66
67
68
69
70
71
72
73
74
75
76
77
78
79
80
81
82
83
84
85
86
87
88
89
90
91
92
93
94
95
96
97
98
99
100
101
102
103
104
105
106
107
108
109
110
111
112
113
114
115
116
117
118
119
120
121
122
123
124
125
126
127
128
129
130
131
132
133
134
135
136
137
138
139
140
141
142
143
144
145
146
147
148
149
150
151
152
153
154
155
156
157
158
159
160
Create a reproducible Python script using pandas that generates a daily

calendar feature table for the period 2020-01-01 through 2035-12-31, with

exactly one row per Gregorian calendar date.
The purpose of the table is to support intra-month target allocation and

Month-to-Date AvT analysis, so it must capture day-of-week, position within

the month, month boundaries, and important holidays/events that can

systematically distort daily business activity.

Required columns

Generate these base calendar fields:

Date

Year

Month

Day

Day_Of_Week - Monday = 0 through Sunday = 6

Day_Of_Week_Name

Is_Weekend - 1 for Saturday/Sunday, otherwise 0

Week_Of_Month - define as CEIL(Day / 7), so days 1-7 = 1, 8-14 = 2, etc.

Is_Month_Start

Is_Month_End

Is_Quarter_End

Is_Year_End

Fixed-date holiday flags

Add binary 0/1 columns for:

Is_Christmas_Day - December 25

Is_Christmas_Day_Plus1 - December 26

Is_New_Years_Eve - December 31

Is_New_Years_Day - January 1

Is_Veterans_Day - November 11

Rule-based holiday and retail-event flags

... (+ Any other fixed special days that have an effect on your metrics)

Add:

Is_Memorial_Day - US Memorial Day, defined as the last Monday in May

Is_Thanksgiving - US Thanksgiving, defined as the fourth Thursday in November

Is_Black_Friday - the Friday immediately after US Thanksgiving

Is_Cyber_Monday - the Monday immediately after US Thanksgiving

... (+ Any other non-fixed special days that have an effect on your metrics)

Also add:

Is_Black_Friday_Weekend - 1 for Black Friday through the following Sunday

Is_Cyber_5 - 1 for the five-day retail period from Thanksgiving through

Cyber Monday

Chinese New Year:

Add accurate Chinese Lunar New Year dates for every year 2020-2035.

Do not infer or approximate Chinese New Year mathematically unless using a

reliable calendar library. Either:

use a reliable lunar-calendar package, or

explicitly define and document a verified year -> Chinese New Year date mapping.

Create:

Is_CNY_Day

Is_CNY_Window_Dm2_to_Dp2 - 1 for CNY day ±2 days

Is_CNY_Dm2 - exactly 2 days before CNY

Is_CNY_Dm1 - exactly 1 day before CNY

Is_CNY_Dp1 - exactly 1 day after CNY

Is_CNY_Dp2 - exactly 2 days after CNY

Validation

... (Add any other moving special days / lunar holidays such as Ramadan that

may have an effect on your metrics)

Before exporting, automatically validate that:

there are no duplicate dates;

there are no missing dates;

every year has exactly one Christmas Day, New Year's Day, New Year's Eve,

Veterans Day, Memorial Day, Thanksgiving, Black Friday, Cyber Monday, and

Chinese New Year;

Memorial Day always falls on a Monday;

Thanksgiving always falls on a Thursday;

Black Friday is exactly one day after Thanksgiving;

Cyber Monday is exactly four days after Thanksgiving;

each CNY ± day flag is exactly the correct number of days from Is_CNY_Day;

leap years contain February 29;

all binary columns contain only 0 and 1.

Print a compact validation summary.

Output

Sort chronologically by Date.

Save as:

daily_holiday_calendar_2020_2035.csv

Also display:

the first 15 rows;

all rows where any holiday or retail-event flag equals 1;

the final dataframe shape.

Write clean, readable, fully executable Python code. Do not fabricate holiday

dates. If a holiday definition is ambiguous, state the assumption explicitly

in the code comments.
Note: We did not include National Lagom Day in the calendar prompt or example model, as its effect on enterprises outside Fashion4Seasons remains insufficiently understood.
Once created, upload it to your DWH.
Step 2: Build Your SQL Model
First, we will build DoW and WoM CTEs that assign weights to the respective time components.
For this lightweight model, we assume that DoW and WoM effects are approximately separable and combine them multiplicatively into a single daily correction weight.
The following snippets are successive CTEs within the same WITH clause and are separated here only for readability.
Day of Week Index
Start with a CTE that assigns a historical weight to each day type, including the special calendar days we flagged earlier. Let’s choose Sales_USD, and add a geographic dimension “Region”, to demonstrate that this model can be broken down to dimensions.
1
2
3
4
5
6
7
8
9
10
11
12
13
14
15
16
17
18
19
20
21
22
23
24
25
26
27
28
29
30
31
32
33
34
35
36
37
38
39
40
41
42
43
44
45
46
47
48
49
50
51
52
53
54
55
56
57
58
59
60
61
62
63
64
65
66
67
68
69
70
71
72
73
74
75
76
77
78
79
80
81
82
83
84
85
86
87
88
89
90
91
92
93
94
95
96
97
98
99
100
101
102
103
104
105
106
107
108
109
110
111
112
113
114
115
116
117
118
119
120
121
122
123
124
125
126
127
128
129
130
131
132
133
134
135
136
137
138
139
140
141
142
143
144
145
146
147
148
149
150
151
152
153
154
155
156
157
158
159
160
WITH DoW_Correction_Index AS (
WITH base_table AS (
SELECT
 sales.Region,
 sales.Date,
-- Sunday is used as the first day of the week
 DATE_TRUNC(sales.Date, WEEK(SUNDAY)) AS Week_Start,
cal.Day AS Day_Of_Month,
/*
 Create mutually exclusive day types.
IMPORTANT:
 1. Exceptional calendar effects come first.
 2. Region applicability is explicitly defined.
 3. This CASE must remain consistent with the CASE
 used later in date_table.
If an event is not relevant to a region, the date
 falls through to its ordinary calendar classification.
 */
CASE
-- --------------------------------------------
 -- Broad / cross-regional holidays
 -- --------------------------------------------
WHEN cal.Is_Christmas_Day = 1
 THEN 'Christmas Day'
WHEN cal.Is_New_Years_Eve = 1
 THEN 'New Years Eve'
WHEN cal.Is_New_Years_Day = 1
 THEN 'New Years Day'
-- --------------------------------------------
 -- North America-specific holidays
 -- --------------------------------------------
WHEN cal.Is_Thanksgiving = 1
 AND sales.Region = 'North America'
 THEN 'Thanksgiving'
WHEN cal.Is_Memorial_Day = 1
 AND sales.Region = 'North America'
 THEN 'Memorial Day'
WHEN cal.Is_Veterans_Day = 1
 AND sales.Region = 'North America'
 THEN 'Veterans Day'
-- --------------------------------------------
 -- Retail events relevant to selected regions
 -- Adjust this list to your business
 -- --------------------------------------------
WHEN cal.Is_Black_Friday = 1
 AND sales.Region IN (
 'North America',
 'South America',
 'Scandinavia',
 'Rest of Europe'
 )
 THEN 'Black Friday'
WHEN cal.Is_Cyber_Monday = 1
 AND sales.Region IN (
 'North America',
 'South America',
 'Scandinavia',
 'Rest of Europe'
 )
 THEN 'Cyber Monday'
-- --------------------------------------------
 -- Chinese New Year window
 -- Relevant here to China only
 -- --------------------------------------------
WHEN cal.Is_CNY_Dm1 = 1
 AND sales.Region = 'China'
 THEN 'Chinese Lunar New Year (D-1)'
WHEN cal.Is_CNY_Day = 1
 AND sales.Region = 'China'
 THEN 'Chinese Lunar New Year (D0)'
WHEN cal.Is_CNY_Dp1 = 1
 AND sales.Region = 'China'
 THEN 'Chinese Lunar New Year (D+1)'
-- --------------------------------------------
 -- Interaction between DoW and month position
 -- --------------------------------------------
WHEN cal.Day_Of_Week_Name = 'Monday'
 AND cal.Day = 1
 THEN 'Monday 1st'
WHEN cal.Day_Of_Week_Name = 'Tuesday'
 AND cal.Day = 1
 THEN 'Tuesday 1st'
WHEN cal.Day_Of_Week_Name IN (
 'Wednesday',
 'Thursday',
 'Friday'
 )
 AND cal.Day = 1
 THEN 'Wed_Fri 1st'
WHEN cal.Is_Weekend = 1
 AND cal.Day = 1
 THEN 'Weekend 1st'
-- Normal days
 ELSE cal.Day_Of_Week_Name
END AS Day_Of_Week_Adjusted,
SUM(sales.Sales_USD) AS Sales_USD
FROM Sales AS sales
LEFT JOIN daily_holiday_calendar_2020_2035 AS cal
 ON sales.Date = cal.Date
/*
 Use complete historical weeks only.
This prevents the current partial week from affecting
 the historical day-type correction indices.
 */
 WHERE sales.Date >= DATE '2020-01-05' -- 1-4 were an incomplete week
 AND sales.Date < DATE_TRUNC(
 CURRENT_DATE(),
 WEEK(SUNDAY)
 )
GROUP BY
 sales.Region,
 sales.Date,
 Week_Start,
 cal.Day,
 Day_Of_Week_Adjusted
 ),
base2 AS (
SELECT
 Date,
 Region,
 Week_Start,
 Day_Of_Month,
 Day_Of_Week_Adjusted,
 Sales_USD,
/*
 Normalize each day against the average daily sales
 of its own week and region.
1.20 = 20% stronger than the average day that week
 0.80 = 20% weaker than the average day that week
 */
 SAFE_DIVIDE(
 Sales_USD,
 AVG(Sales_USD) OVER (
 PARTITION BY Week_Start, Region
 )
 ) AS Pct_From_Week_Average
FROM base_table
 )
SELECT
 Region,
 Day_Of_Week_Adjusted,
/*
 Average across historical occurrences to estimate
 the typical relative performance of each day type.
 */
 AVG(Pct_From_Week_Average) AS DoW_Correction_Index,
/*
 Useful when auditing rare holiday/event categories.
 A holiday may have only a handful of historical
 observations compared with hundreds of normal weekdays.
 */
 COUNT(*) AS Num_Observations
FROM base2
GROUP BY
 Region,
 Day_Of_Week_Adjusted
),

-- Rest of the model can now use:
-- DoW_Correction_Index
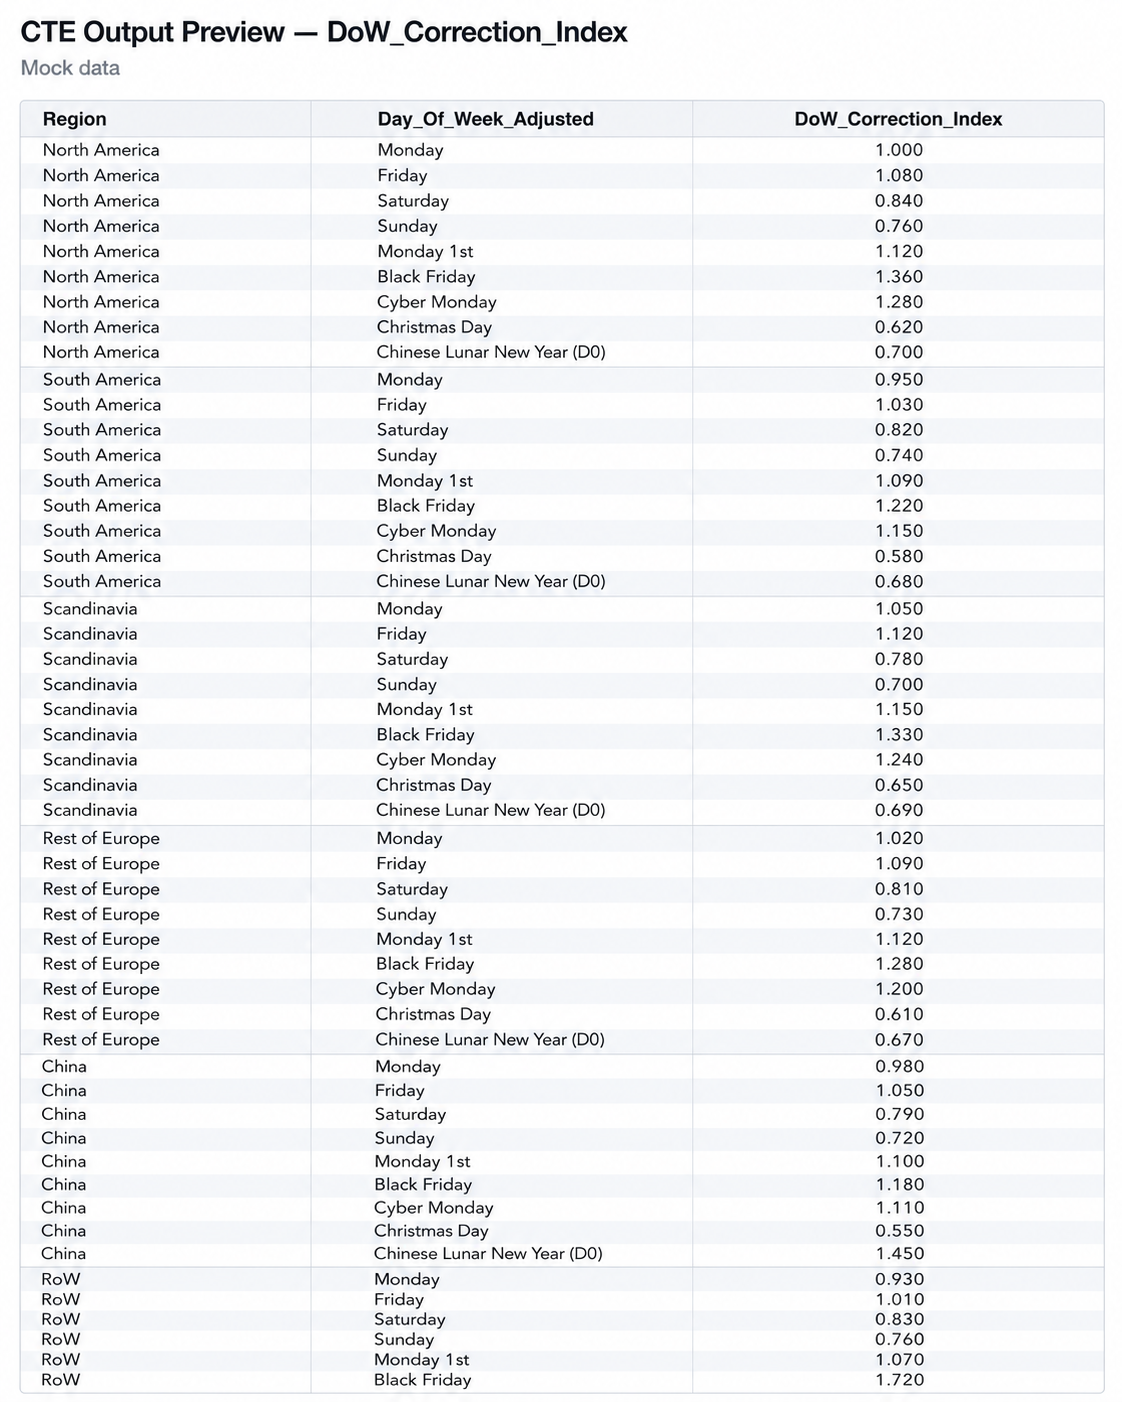
This CTE results in a table that matches weights to each type of day we created:
Week of Month Index
Here we have two objectives: first, to assign a relative weight to each week of the month; and second, to identify partial weeks and adjust their contribution according to the number of days they actually contain.
1
2
3
4
5
6
7
8
9
10
11
12
13
14
15
16
17
18
19
20
21
22
23
24
25
26
27
28
29
30
31
32
33
34
35
36
37
38
39
40
41
42
43
44
45
46
47
48
49
50
51
52
53
54
55
56
57
58
59
60
61
62
63
64
65
66
67
68
69
70
71
72
73
74
75
76
77
78
79
80
81
82
83
84
85
86
87
88
89
90
91
92
93
94
95
96
97
98
99
100
101
102
103
104
WoM_Correction_Index AS (
/*
 STEP 1:
 Aggregate sales by Region, Month, and Week of Month.
We also determine how many calendar days belong to each
 Week-of-Month bucket.
Example for a 31-day month:
 WoM 1 = 7 days
 WoM 2 = 7 days
 WoM 3 = 7 days
 WoM 4 = 7 days
 WoM 5 = 3 days
 */
 WITH base_table AS (
SELECT
 sales.Region,
 cal.Week_Of_Month,
DATE_TRUNC(cal.Date, MONTH) AS MonthDate,
MAX(
 LEAST(
 7,
 EXTRACT(DAY FROM LAST_DAY(cal.Date, MONTH))
 - ((cal.Week_Of_Month - 1) * 7)
 )
 ) AS Num_Days_in_Week,
SUM(sales.Sales_USD) AS Sales_USD
FROM Sales AS sales
LEFT JOIN daily_holiday_calendar_2020_2035 AS cal
 ON sales.Date = cal.Date
/*
 Use completed historical months only.
The current month is excluded because its later WoM buckets
 may not yet have occurred, which would distort the historical index.
 */
 WHERE sales.Date >= DATE '2020-01-01'
 AND sales.Date < DATE_TRUNC(CURRENT_DATE(), MONTH)
GROUP BY
 sales.Region,
 cal.Week_Of_Month,
 MonthDate
 ),
/*
 STEP 2:
 Convert every WoM bucket to a 7-day equivalent.
This is especially important for Week 5.
Example:
 If Week 5 contains only 3 days and generates $300K:
$300K / 3 * 7 = $700K
We therefore compare its underlying daily intensity with the
 other weeks rather than treating $300K as a full-week result.
 */
 base2 AS (
SELECT
 Region,
 Week_Of_Month,
 MonthDate,
 Num_Days_in_Week,
 Sales_USD,
SAFE_DIVIDE(
 Sales_USD,
 Num_Days_in_Week
 ) * 7 AS Weekly_Sales_7_Days_Adj
FROM base_table
 ),
/*
 STEP 3:
 Normalize each week against the average normalized week
 within the same Region and Month.
Interpretation:
1.10 = this WoM was 10% stronger than the average week
 1.00 = average
 0.90 = 10% weaker than average
Normalizing within each month helps prevent overall growth,
 seasonality, or business scale from contaminating the WoM effect.
 */
 base3 AS (
SELECT
 Region,
 Week_Of_Month,
 MonthDate,
 Num_Days_in_Week,
 Weekly_Sales_7_Days_Adj,
SAFE_DIVIDE(
 Weekly_Sales_7_Days_Adj,
 AVG(Weekly_Sales_7_Days_Adj) OVER (
 PARTITION BY Region, MonthDate
 )
 ) AS Pct_From_Month_Average
FROM base2
 )
/*
 STEP 4:
 Average the historical relative performance of each
 Week of Month across all completed months.
 */
 SELECT
 Region,
 Week_Of_Month,
AVG(Pct_From_Month_Average) AS WoM_Correction_Index
FROM base3
GROUP BY
 Region,
 Week_Of_Month
),
The previous CTEs built the part of the model that calculates the weights of our different time components. The next step is to take the target metric - in this case, the FP&A sales target for each region - allocate it across the relevant dates based on those weights, and then aggregate the corresponding actual sales. This allows us to compare Actuals vs. Target (AvT) on a like-for-like, time-adjusted basis.
Date Skeleton CTE for our final output
1
2
3
4
5
6
7
8
9
10
11
12
13
14
15
16
17
18
19
20
21
22
23
24
25
26
27
28
29
30
31
32
33
34
35
36
37
38
39
40
41
42
43
44
45
46
47
48
49
50
51
52
53
54
55
56
57
58
59
60
61
62
63
64
65
66
67
68
69
70
71
72
73
74
75
76
77
78
79
80
81
82
83
84
85
86
87
88
89
90
91
92
93
94
95
96
97
98
99
100
101
102
103
104
105
106
107
108
109
110
111
112
113
114
115
116
117
118
date_table AS (
SELECT
 Region,
 cal.Date,
 cal.Year,
 cal.Month,
 cal.Day AS Day_Of_Month,
 cal.Week_Of_Month,
 cal.Day_Of_Week_Name AS Day_Name,
 DATE_TRUNC(cal.Date, MONTH) AS Month_Date,
EXTRACT(
 DAY FROM LAST_DAY(cal.Date, MONTH)
 ) AS Num_Days_In_Month,
DATE_TRUNC(
 cal.Date,
 WEEK(SUNDAY)
 ) AS Week_Start,
/*
 IMPORTANT:
 This classification logic must match the logic used
 when building DoW_Correction_Index.
If a holiday is not relevant to a particular region,
 the date simply falls through to its normal day type.
 */
 CASE
-- --------------------------------------------
 -- Broad / cross-regional holidays
 -- --------------------------------------------
WHEN cal.Is_Christmas_Day = 1
 THEN 'Christmas Day'
WHEN cal.Is_New_Years_Eve = 1
 THEN 'New Years Eve'
WHEN cal.Is_New_Years_Day = 1
 THEN 'New Years Day'
-- --------------------------------------------
 -- North America-specific holidays
 -- --------------------------------------------
WHEN cal.Is_Thanksgiving = 1
 AND Region = 'North America'
 THEN 'Thanksgiving'
WHEN cal.Is_Memorial_Day = 1
 AND Region = 'North America'
 THEN 'Memorial Day'
WHEN cal.Is_Veterans_Day = 1
 AND Region = 'North America'
 THEN 'Veterans Day'
-- --------------------------------------------
 -- Retail events relevant to selected regions
 -- Adjust this list to your business
 -- --------------------------------------------
WHEN cal.Is_Black_Friday = 1
 AND Region IN (
 'North America',
 'South America',
 'Scandinavia',
 'Rest of Europe'
 )
 THEN 'Black Friday'
WHEN cal.Is_Cyber_Monday = 1
 AND Region IN (
 'North America',
 'South America',
 'Scandinavia',
 'Rest of Europe'
 )
 THEN 'Cyber Monday'
-- --------------------------------------------
 -- Chinese New Year window
 -- --------------------------------------------
WHEN cal.Is_CNY_Dm1 = 1
 AND Region = 'China'
 THEN 'Chinese Lunar New Year (D-1)'
WHEN cal.Is_CNY_Day = 1
 AND Region = 'China'
 THEN 'Chinese Lunar New Year (D0)'
WHEN cal.Is_CNY_Dp1 = 1
 AND Region = 'China'
 THEN 'Chinese Lunar New Year (D+1)'
-- --------------------------------------------
 -- Interaction between DoW and month position
 -- --------------------------------------------
WHEN cal.Day_Of_Week_Name = 'Monday'
 AND cal.Day = 1
 THEN 'Monday 1st'
WHEN cal.Day_Of_Week_Name = 'Tuesday'
 AND cal.Day = 1
 THEN 'Tuesday 1st'
WHEN cal.Day_Of_Week_Name IN (
 'Wednesday',
 'Thursday',
 'Friday'
 )
 AND cal.Day = 1
 THEN 'Wed_Fri 1st'
WHEN cal.Is_Weekend = 1
 AND cal.Day = 1
 THEN 'Weekend 1st'
-- Normal days
 ELSE cal.Day_Of_Week_Name
END AS Day_Of_Week_Adjusted
FROM daily_holiday_calendar_2020_2035 AS cal
/*
 Expand every calendar date across the business dimensions
 for which separate allocation weights are required.
 */
 CROSS JOIN UNNEST([
 'North America',
 'South America',
 'Scandinavia',
 'Rest of Europe',
 'China',
 'RoW'
 ]) AS Region
-- Allocation timeframe: current calendar year
 WHERE cal.Year = EXTRACT(
 YEAR FROM CURRENT_DATE()
 )
),
Actuals
1
2
3
4
5
6
7
8
9
10
11
12
13
14
15
16
actuals AS (
SELECT
 sales.Date,
-- First day of the month, kept as a DATE
 DATE_TRUNC(sales.Date, MONTH) AS Month_Date,
sales.Region,
-- Daily actual sales by region
 SUM(sales.Sales_USD) AS Sales_USD
FROM Sales AS sales
-- Keep only the current calendar year
 WHERE EXTRACT(YEAR FROM sales.Date) = EXTRACT(YEAR FROM CURRENT_DATE())
GROUP BY
 sales.Date,
 Month_Date,
 sales.Region
),
Now for the final SELECT. At this stage, we join the model to the FP&A monthly sales targets by region, stored in a table called Targets.
1
2
3
4
5
6
7
8
9
10
11
12
13
14
15
16
17
18
19
20
21
22
23
24
25
26
27
28
29
30
31
32
33
34
35
36
37
38
39
40
41
42
43
44
45
46
47
48
49
50
51
52
53
54
55
56
57
58
59
60
61
62
63
64
65
66
67
68
69
70
71
72
73
74
75
76
77
78
79
80
81
82
83
84
85
86
87
88
89
90
91
92
93
94
95
96
97
98
99
100
101
102
103
104
105
106
107
108
109
110
111
112
113
114
115
116
117
118
119
120
121
122
123
124
125
126
127
128
129
130
131
132
133
134
135
136
137
138
139
140
141
142
143
144
allocation_base AS (
SELECT
 dt.Region,
 dt.Date,
 dt.Week_Of_Month,
 dt.Month_Date,
 dt.Day_Of_Month,
 dt.Num_Days_In_Month,
 dt.Day_Name,
 dt.Day_Of_Week_Adjusted,
-- Historical correction indices
 dwci.DoW_Correction_Index,
 wmci.WoM_Correction_Index,
/*
 Combined correction weight for this specific date.
COALESCE(..., 1) provides a neutral fallback if no
 historical correction index is available.
 */
 COALESCE(dwci.DoW_Correction_Index, 1.0)
 * COALESCE(wmci.WoM_Correction_Index, 1.0)
 AS Correction_Weight,
-- Monthly FP&A target for this region
 targets.Sales_Target AS Region_Monthly_Target,
-- Actual sales observed on this date
 actuals.Sales_USD
FROM date_table AS dt
LEFT JOIN actuals
 ON actuals.Date = dt.Date
 AND actuals.Region = dt.Region
LEFT JOIN DoW_Correction_Index AS dwci
 ON dt.Day_Of_Week_Adjusted = dwci.Day_Of_Week_Adjusted
 AND dt.Region = dwci.Region
LEFT JOIN WoM_Correction_Index AS wmci
 ON dt.Week_Of_Month = wmci.Week_Of_Month
 AND dt.Region = wmci.Region
LEFT JOIN Targets AS targets
 ON dt.Month_Date = targets.Month_Date
 AND dt.Region = targets.Region
),
allocation AS (
SELECT
 Region,
 Date,
 Week_Of_Month,
 Month_Date,
 Day_Of_Month,
 Num_Days_In_Month,
 Day_Name,
 Day_Of_Week_Adjusted,
 DoW_Correction_Index,
 WoM_Correction_Index,
 Correction_Weight,
/*
 Sum of all daily correction weights in the month.
This becomes the denominator used to convert the raw
 correction weights into percentages that sum to 100%.
 */
 SUM(Correction_Weight) OVER (
 PARTITION BY Month_Date, Region
 ) AS Sum_Correction_Weights_In_Month,
/*
 Expected share of the monthly target allocated
 specifically to this date.
 */
 SAFE_DIVIDE(
 Correction_Weight,
 SUM(Correction_Weight) OVER (
 PARTITION BY Month_Date, Region
 )
 ) AS Daily_Allocation_Pct,
/*
 Cumulative expected share of the monthly target
 through this date.
Example:
 0.40 means that historically we would expect
 40% of the month's activity to have occurred
 by this point in the month.
 */
 SAFE_DIVIDE(
 SUM(Correction_Weight) OVER (
 PARTITION BY Month_Date, Region
 ORDER BY Date
 ROWS BETWEEN UNBOUNDED PRECEDING AND CURRENT ROW
 ),
 SUM(Correction_Weight) OVER (
 PARTITION BY Month_Date, Region
 )
 ) AS Cumulative_MTD_Allocation_Pct,
Region_Monthly_Target,
/*
 Allocate the monthly FP&A target to the individual day
 according to its share of the month's correction weights.
 */
 Region_Monthly_Target
 * SAFE_DIVIDE(
 Correction_Weight,
 SUM(Correction_Weight) OVER (
 PARTITION BY Month_Date, Region
 )
 ) AS Daily_Target,
Sales_USD
FROM allocation_base
),
allocation_with_mtd AS (
SELECT
 *,
/*
 Cumulative actual sales through this date.
COALESCE treats dates with no recorded sales as zero.
 */
 SUM(COALESCE(Sales_USD, 0)) OVER (
 PARTITION BY Month_Date, Region
 ORDER BY Date
 ROWS BETWEEN UNBOUNDED PRECEDING AND CURRENT ROW
 ) AS Actual_MTD,
/*
 Cumulative allocated target through this date.
Unlike a linear target, this reflects the expected
 intra-month distribution of business activity.
 */
 SUM(Daily_Target) OVER (
 PARTITION BY Month_Date, Region
 ORDER BY Date
 ROWS BETWEEN UNBOUNDED PRECEDING AND CURRENT ROW
 ) AS Target_MTD
FROM allocation
)
SELECT
 *,
/*
 Actual vs. Target through this date.
1.00 = exactly on target
 1.05 = 5% above target
 0.95 = 5% below target
 */
 SAFE_DIVIDE(
 Actual_MTD,
 Target_MTD
 ) AS MTD_AvT_Pct
FROM allocation_with_mtd
WHERE Date <= CURRENT_DATE() -- Don't show MTD AvT for future dates
ORDER BY
 Region,
 Date;
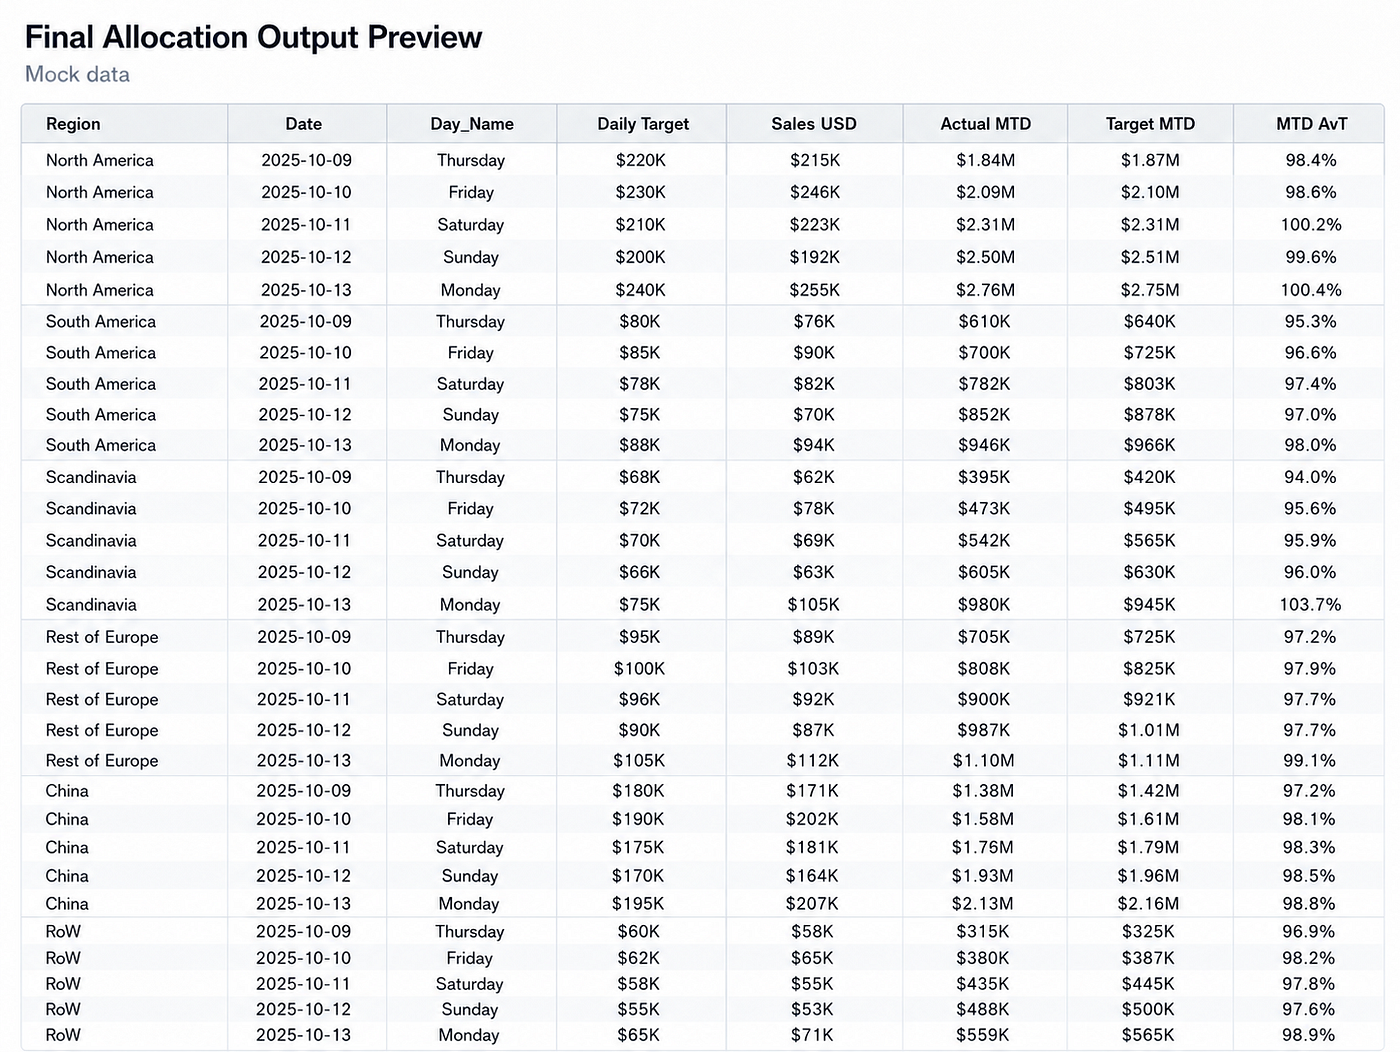
Final Output:
Conclusion
Month-to-Date performance looks simple only when we assume that time progresses linearly for the business. In reality, weekdays, weekends, position within the month, holidays, and other recurring calendar effects can make a monthly target very unevenly distributed across its days.
By combining a business-specific calendar table with historical DoW and WoM correction indices, we can allocate monthly targets according to how the business actually behaves - rather than according to how the calendar happens to be divided.
The result is a lightweight SQL framework that gives managers a much more meaningful answer to the question they inevitably ask before month-end: “Where do we actually stand against target today?”
What unexpected factors make sales nonlinear in your business? I’d love to hear them.
Originally published on Medium.