Range Against the Machine Case 2 - Beating AutoML by Looking Under the Hood

Used-car pricing prediction with business signals, not just buttons to click
In this article, we’ll explore several key data preprocessing techniques. We will cover the following topics:
- Hierarchical Missing Value Imputation
- Manual Missing Value Imputation
- Automated Missing Value Imputation
- Business Domain-Driven Feature Engineering
- Generative AI-Based Data Enrichment
Will it be enough to beat the machine again?
Again, I was officially assigned by the Massachusetts Institute of Technology to re-examine an iconic dataset, this time the India used-cars dataset, widely mirrored and originally scraped from CarDekho listings. In practice, the most common variant is a 7.2k × 14 table (Name, Location, Year, Kilometers_Driven, Fuel_Type, Transmission, Owner, Mileage, Engine, Power, Seats, New_Price, Price - target) that has circulated in tutorials since ~2019–2020. Licensing varies by Kaggle mirror. Performance-wise, tree-based regressors routinely reach ~0.93–0.94 R², whereas straightforward linear models can drop below 0.70 R². The name of the game here is rigorous cleaning and missing-value imputation. In this article, the added value you won’t find in common cover versions, is a little bit of used-car domain sense, the kind anyone who’s bought a second-hand car once or twice (or five times, in my case) brings to the table.
The Car that Circled India 285 Times at 247 km/h or Why We Shouldn’t Skip df.describe().T
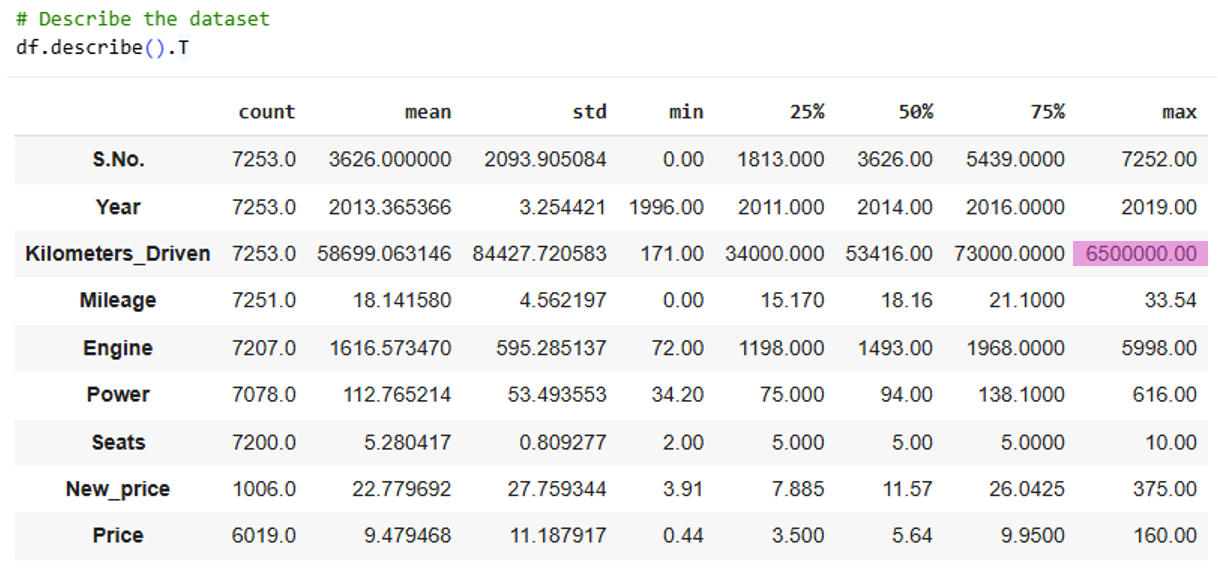
Before the deep dive, I like to eyeball the data. A quick describe().T served up a spit-take: five zeros in a row. According to the dataset, a 2017 BMW X5 had racked up 6.5 million km and was listed for ₹65 lakh. To do that by 2020, it would have needed to average ~247 km/h nonstop-no fuel stops, no maintenance, no sleep, no bathroom breaks. Even with relay drivers, that’s not “unlikely,” it’s impossible. So…someone fat-fingered a zero. Or two. (If three - send me the seller’s number; that’s a steal.) Long story short, I treated it as an outlier and replaced it with the mean kilometers for 2017 models.
Leveraging Messy ‘Name’ String for Missing-Value Imputation - Parsing Chaos into Signal
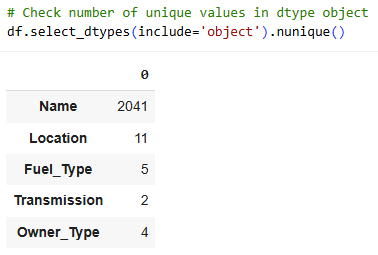
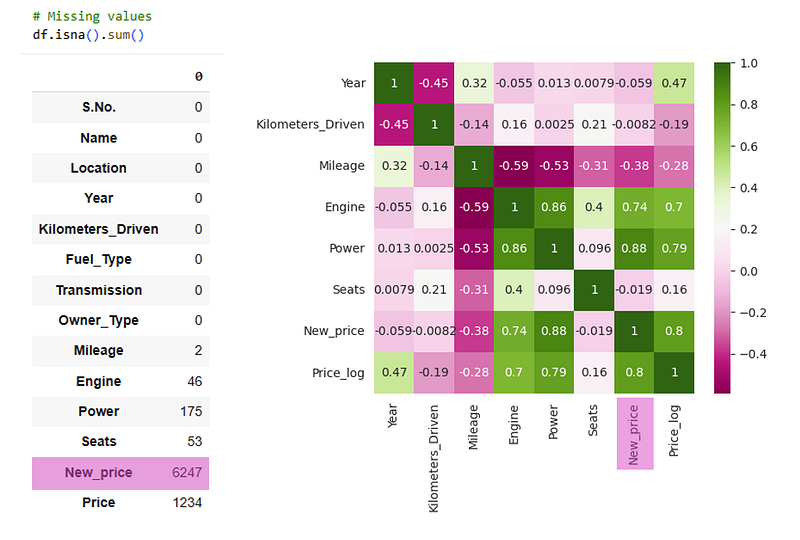
A brief glance at the dataset reveals that we have 2 main challenges in the dataset:
- The field ‘Name’ hides valuable information like make and model, but contains 2041 unique values. That is, due to inconsistent entries. Some would specify sub-models in the listing and some wouldn’t. Even if we narrow it to make and model, it would result in too many categories for our dataset.
- We have too many missing values, especially in the ‘New_Price’ variable, that showed the highest correlation with our target - Price
How much signal hides in “Name”? More than you’d think
Exact sub-model match.
A bunch of the fields with gaps are basically factory specs - New_price, Mileage, Engine, Power, Seats. Within the same sub-model, these barely change. So if two listings share the exact ‘Name’ (e.g., BMW X5 xDrive30d M Sport), we can borrow specs from the ones that have them. First pass is dead simple: impute by the exact sub-model-use the mean for numeric fields and the mode for categoricals. It’s low-tech but high-yield: squeezing clean, reliable values out of the messiest column in the dataset.
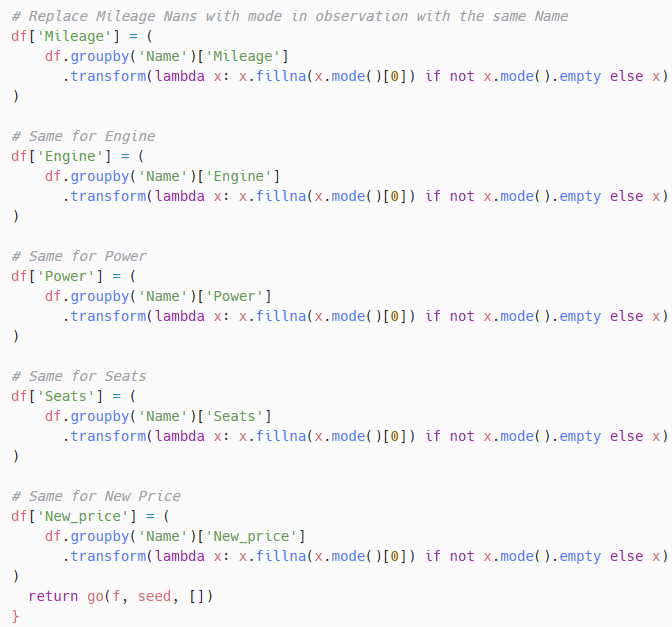
Hierarchical Missing-Value Imputation
‘Name’ is all over the place. The same car shows up as “Toyota Corolla Altis 1.8 G CNG” or just “Toyota Corolla Altis.” Sometimes one trim is missing a value while a sibling trim has everything. So instead of guessing, we start narrow and widen the circle: fill from the closest sub-model first, then back off step by step if that exact variant isn’t available.
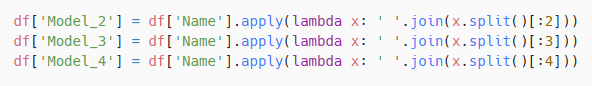
Step 1: Build simple prefixes from ‘Name’- the first 4, 3, and 2 tokens-and impute in that order (numeric → median, categorical → mode). Example for “Toyota Corolla Altis 1.8 G CNG”:
- Model_4: “Toyota Corolla Altis 1.8”
- Model_3: “Toyota Corolla Altis”
- Model_2: “Toyota Corolla”
The rule is closest match wins: try Model_4; if still missing, fall back to Model_3; then Model_2; only then consider broader groups (Make) or a global fallback. It’s lightweight, auditable, and surprisingly powerful at turning messy names into dependable fills.
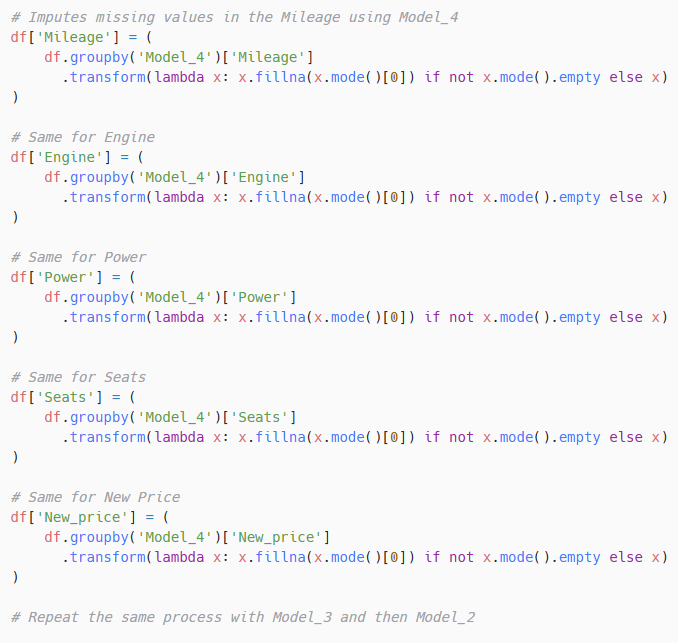
Step 2: Fill the gaps with closest-match first. Now we use the hierarchy we built to impute the blanks. For each missing value, I search inside the most specific bucket first:
Model_4 → Model_3 → Model_2 → (optional) Make → global fallback.
I used mode in all cases, but you can try other methods: Numerics get the median, categoricals the mode. If a bucket is too small (or empty), I back off to the next level. This “closest match wins” approach preserves detail when it exists and stays sane when it doesn’t.
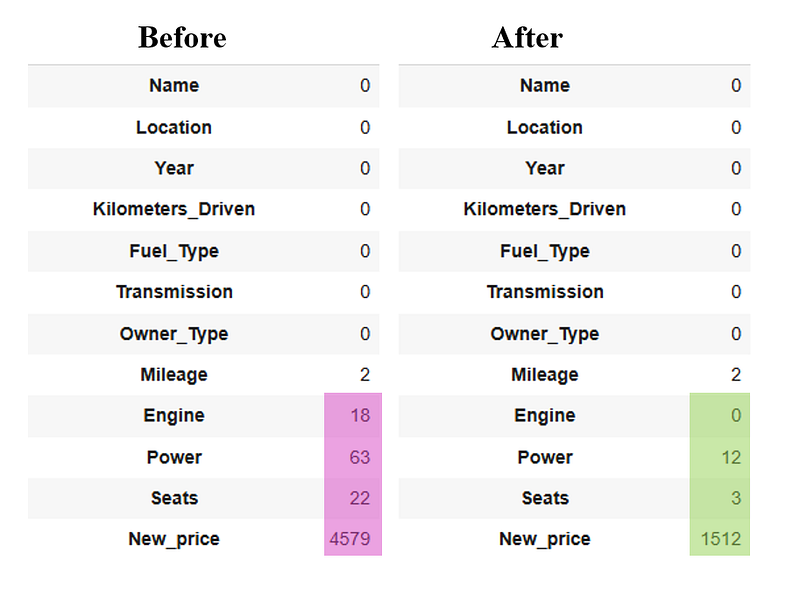
Our missing values balance, before and after:
Leveraging “Name” + Gen-AI for Data Enrichment
Next, I used the raw ‘Name’ to tag each car with a class (Sub/Mini-compact, Compact, Minivan, Mid-Size, Large, Small SUV, Standard SUV, Sport/Two-Seater). Different classes target different buyers and often depreciate differently, so this feature can add lift for used-price modeling. Rather than pick one official taxonomy (Euro NCAP, US EPA, China, etc.), I built a compact, balanced schema that keeps categories frequent enough to be useful. How it works (lightweight and reproducible):
- Noise filter / normalization: Strip engine badges, trims, drivetrains, years, and other junk (e.g., VTEC, CRDi, AT, 4x4) to isolate the core make–model - same idea as the hierarchical imputation step.
- Dictionary + back-off: Use an LLM-assisted dictionary to map cleaned names to classes, then apply the same hierarchical back-off (most specific → broader) to fill what the exact key misses.
This captured about five-sixths of rows, leaving ~1/6 unknown for later handling. I won’t paste the long LLM-generated script here, but it’s in my GitHub. Moral of the story: a pinch of domain sense plus Gen-AI scaffolding = fast, low-effort enrichment. The gain was modest - but it cost me almost nothing to implement.
Other Missing-Value Imputation
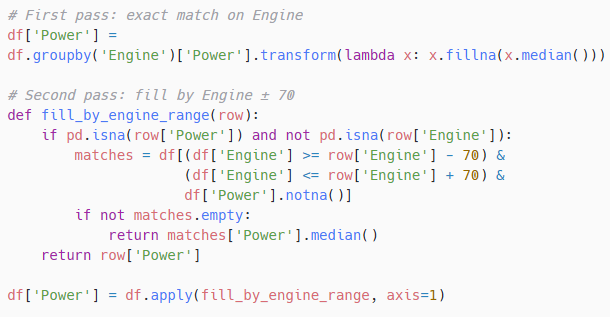
I still had 12 missing Power values. Since ‘Engine’ and ‘Power’ move together (see the heatmap), I used engine size as a proxy. First, I looked for an exact displacement match (e.g., 1798 cc). If none existed, I widened the net to ±70 cc and took the median Power from those near-neighbors. Why this works: the ±70 cc window is tight enough to keep comparable trims, but wide enough to find comps; using the median keeps outliers from skewing the fill.
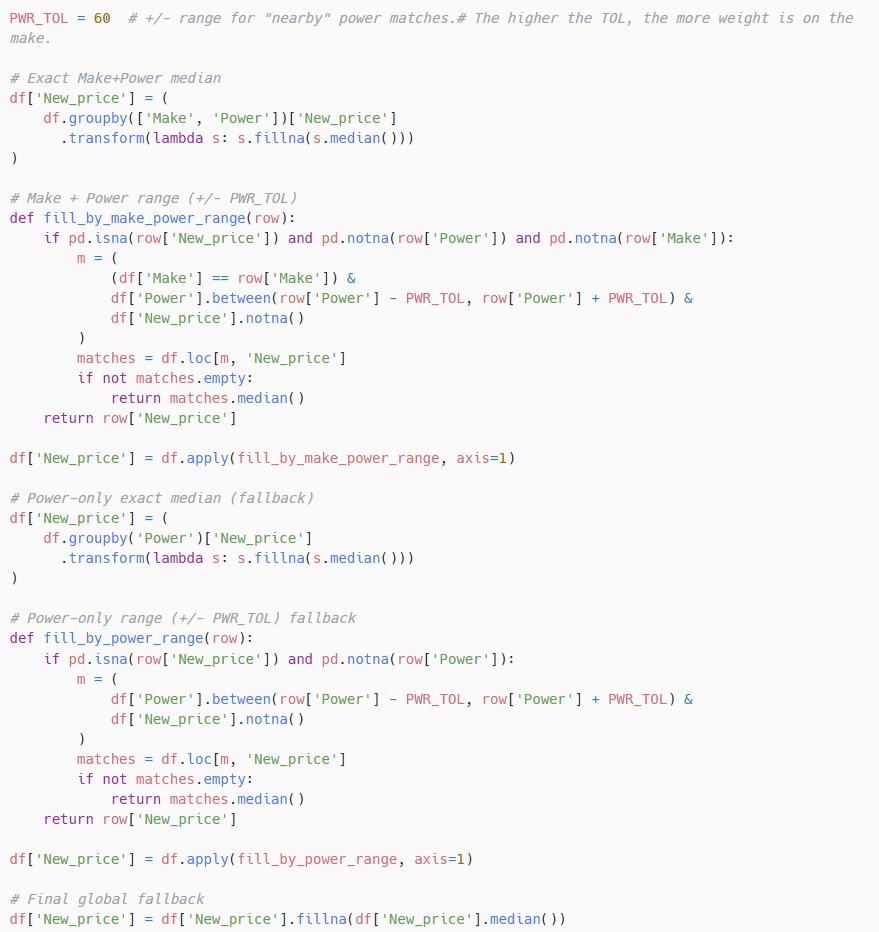
The next hurdle was imputing the 1,512 missing New_price values. A quick heatmap shows New_price is strongly tied to Power, but using a single feature gives a partial picture. Brands carry big, stable price premia, so I first try to match Make + Power (with a tolerance), and only then fall back to power-only matches. The “business” logic is obvious: a ~150 hp Tata Hexa XT is not priced like a ~150 hp Land Rover Discovery Sport TD4 HSE 7S when new - brand matters. You can see the brand stratification in the tails: among cars >300 hp, the counts skew to German luxury makes.
below 100 hp, we see Maruti, Hyundai, Honda dominate - affordable mass-market brands. That means the high overall correlation between Power and New_price is heterogeneous across brands. In practice, I use a hierarchical imputation: (1) fill by median within the same Make and similar Power (±hp window), then (2) fall back to power-only matches if needed, and finally (3) a global fallback. A narrow hp window leans more on power similarity (and may cross brands); a wider window increases the chance of finding same-brand matches, effectively giving more weight to Make even if the hp gap is larger.
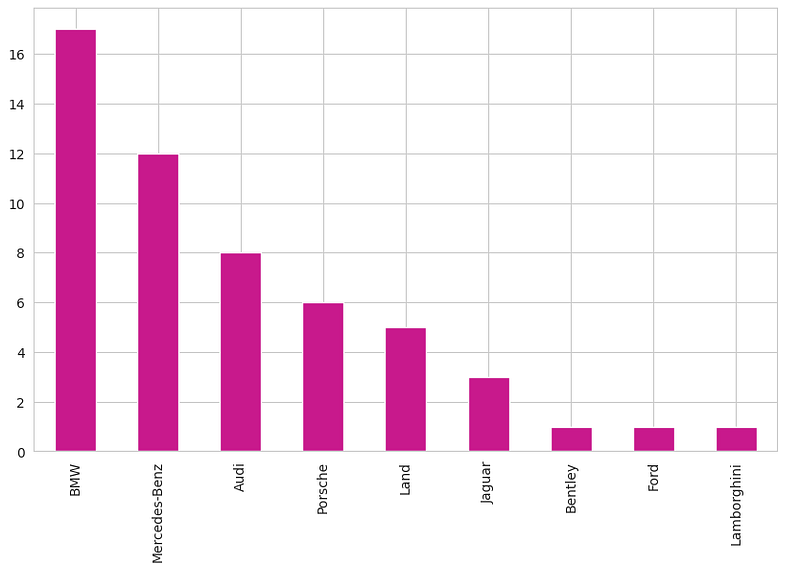
Step 1: Create ‘Make’ Variable:
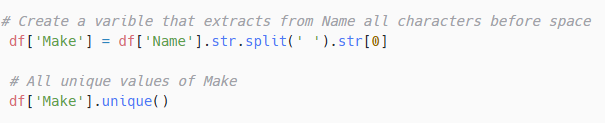
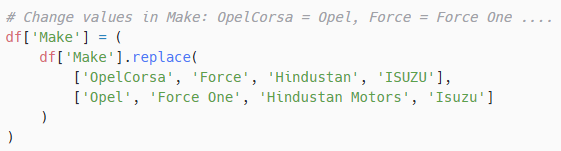
Cleaning the variable:
Step 2: Using ‘Make’ in Missing-Value Imputation
Feature Engineering
Mileage matters - just not equally for everyone
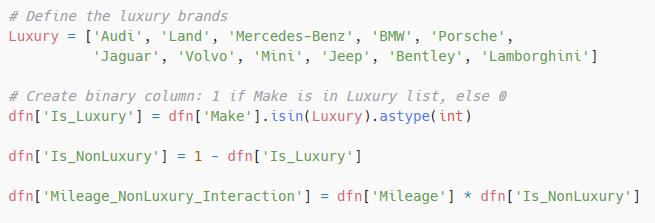
Mileage is a parameter for fuel efficiency. High mileage means that the car uses less fuel to drive more kilometers. A base model I preliminary ran on the dataset showed a very limited effect of Mileage on the target - Price. We know that fuel efficiency is a very desired feature in cars. When I look for a new car, I always check its efficiency and it plays a crucial role in my decision making. Most of us, when we buy a car, ask Immediately “how much fuel does it drink”. Who doesn’t? Well… some don’t. People who are willing to spend enormous amounts on luxury cars, apparently have different priorities. Therefore I decided to create an interaction between luxurious makes and Mileage:
Age
For explanatory reasons only I replaced Year with Age.
KM Driven Per Year
Buyers prefer less worn-out cars - cars that sat in the garage most of the time, and were driven only around the neighborhood, and to annual checkups. I know it, because this is what I ask for when I go to buy a car at a car dealership. The wear-out is relative to the number age of the car.
KM Driven Per Year - Is Luxury Interaction
Let’s see if luxury cars have different detraction pattern when it comes to relatively high km driven.
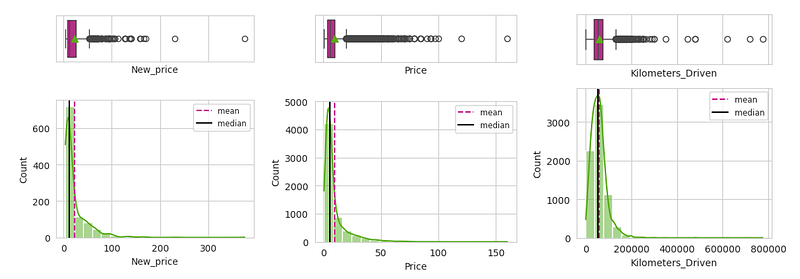
Log Transform
The target (Price) and features (KM_Driven, New_price) were heavily right-skewed, so I applied a log transform (natural log) to reduce skew and stabilize variance. This tends to linearize relationships and makes the model’s fit and residuals behave better.
The log transforming improved the skewness of the variables:
Before:
After:
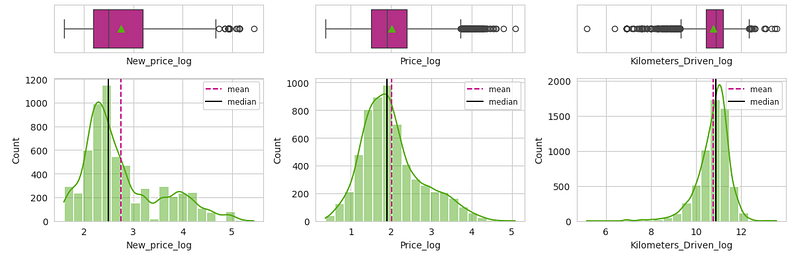
A real makeover…
Range Against the Machine
With preprocessing wrapped, the next step was to see how much lift it actually delivered. As before, I benchmarked against MLJAR AutoML. MLJAR advertises built-in preprocessing - missing-value imputation and feature engineering included - which is exactly where most of the effort went in this dataset. Still, I gave it a fair shot by supplying a generic, one-size-fits-all pipeline suggested by my favorite LLM. The pipeline uses Iterative Imputer (MICE) for numerical features - modeling missing values from observed ones - while imputing categorical features with the mode. It also keeps missingness indicators to preserve signal and produces plausible estimates for nulls without leaking targets. You can find the full code in my Github Repo, link below.
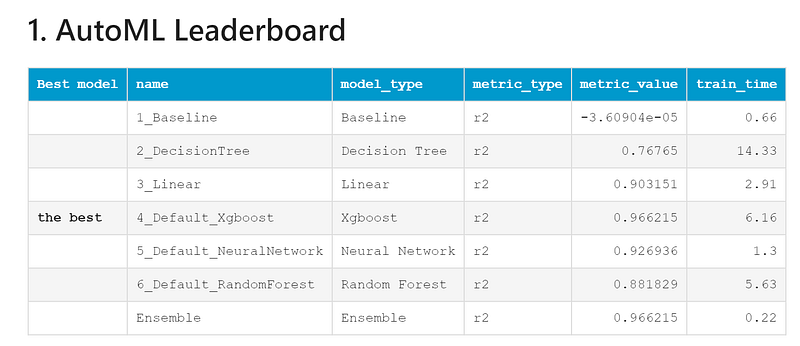
I ran AutoML twice: (1) on the cleaned dataset (only a log transform added), and (2) on the dataset processed by the generic MICE-style imputation pipeline.
Feature Engineering Results
Before we reveal the final numbers, a brief pit stop: how much did the feature engineering actually help? The SHAP plot below illustrates the contribution of the newly engineered features.
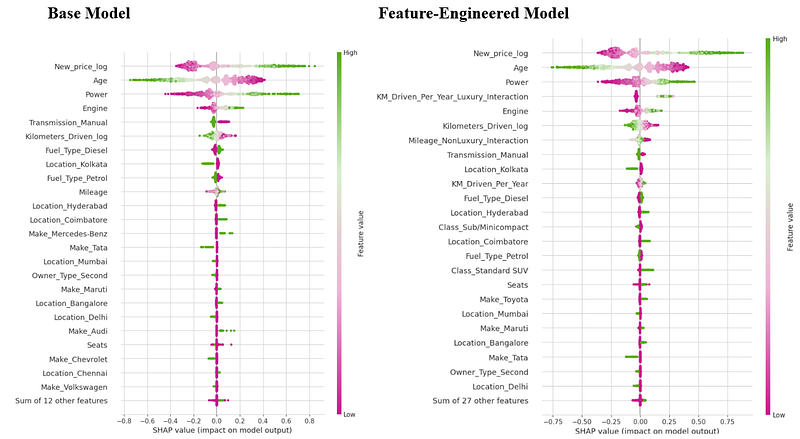
All and all, the engineered featured had a modest contribution to the model. The Mileage-Non luxury interaction gave the fuel efficiency factor more explanatory power and pushed it to №7, vs the previous №10. Our AI-aided Class feature added some signal, suggesting (but not proving) different depreciation patterns for different classes. Our KM Driven Per Year features added some signal on top of KM Driven, while surprisingly, we see that Luxury cars, with higher KM driven per year are a predictor of higher selling price. How come? This is the opposite of the typical expectation for used car price (where higher mileage usually decreases value), which implies that Luxury cars are not more sensitive (in a negative value sense) to high KM per year, but rather, high KM per year provides a net positive or less negative signal in this model, possibly because:
- It indicates frequent maintenance or good running condition.
- It acts as a proxy for newer cars (since the feature is annual mileage, not total odometer reading, and newer cars are often driven more annually).
Model Results
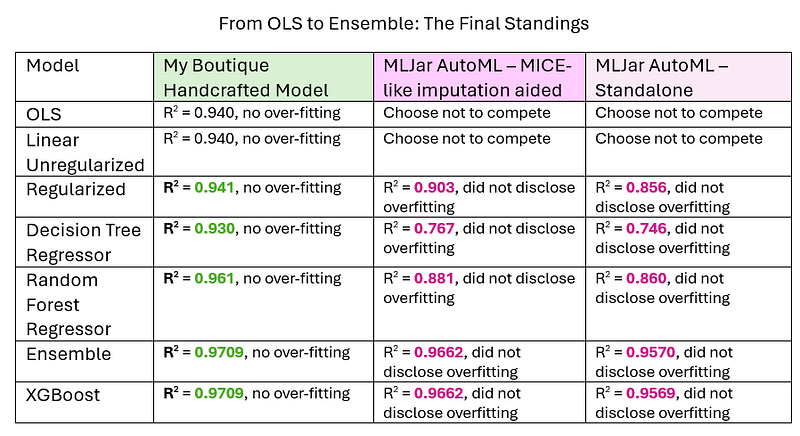
AutoML (standalone) delivered the weakest results: R² < 0.80 with the Decision Tree Regressor, and around R² ≈ 0.85 for both the Random Forest Regressor and the linear model. In contrast, its XGBoost model performed excellent, achieving R² > 0.95.
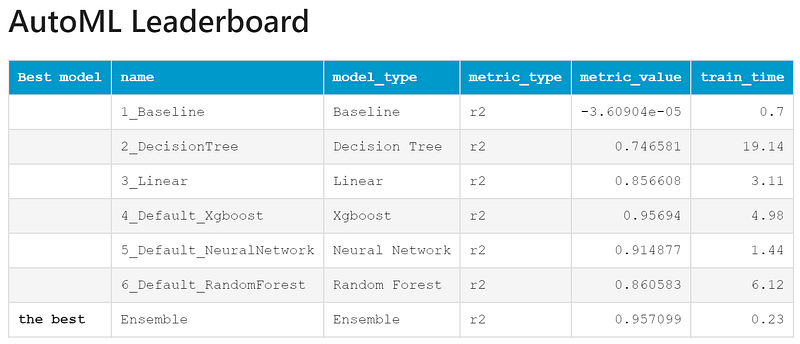
AutoML + MICE-style aid improved every model. The lift was most pronounced for the linear model, which reached R² > 0.90. XGBoost (AutoML) was best-in-class, delivering an excellent R² > 0.966.
These results are striking: a simple, generic, one-size-fits-all pipeline-generated via prompt with near-zero effort- boosted AutoML’s performance despite its own built-in imputation.
But was it enough?
To my surprise, my boutique, hand-crafted models outperformed AutoML by a wide margin. Every model cleared R² = 0.93 - including the linear ones. The decision tree was the weakest and least stable (why? see my article, If a Decision Tree Falls in a Random Forest), while my XGboost delivered an outperforming R² > 0.97.
Summary & Conclusions
The biggest predictive performance gains came from my hand-crafted, hierarchical missing-value imputation. It didn’t require complex Python - just common sense and a careful look at the features.
Despite its simplicity, it outperformed robust ML-aided approaches such as MICE and MLJAR’s built-in preprocessing.
A dose of domain reasoning (the kind a seasoned used-car buyer applies), combined with AI-assisted feature enrichment, added explanatory power and pushed accuracy even further.
Data Dictionary S.No. : Serial Number Name : Name of the car which includes Brand name and Model name Location : The location in which the car is being sold or is available for purchase (Cities) Year : Manufacturing year of the car Kilometers_driven : The total kilometers driven in the car by the previous owner(s) in KM Fuel_Type : The type of fuel used by the car (Petrol, Diesel, Electric, CNG, LPG) Transmission : The type of transmission used by the car (Automatic / Manual) Owner : Type of ownership Mileage : The mileage offered by the car company in kmpl or km/kg Engine : The displacement volume of the engine in CC Power : The maximum power of the engine in bhp Seats : The number of seats in the car New_Price : The price of a new car of the same model in INR 100,000 Price : The price of the used car in INR 100,000 (Target Variable)
You can find the full code notebook and the dataset on my GitHub Repo